Solar 2

Photovoltaic solar cells. Solar PV.

This is not an easy thing to describe. For some, you may want to just skip past the technical section, cause it is pretty technical.

Solar PV: they used to take as much electricity to make as they produced in their lifetime. Now they they produce about 5x as much energy as they take to make, and the time to break-even on emissions compared to our cleanest fossil fuel stations is about 6 years (see Kannan, 2005, Lifecycle Assessment Study of Solar PV). Of all the clean technologies (nuclear power excluded), this is the only one with the potential to supply world energy needs (that is the subject of a later post).

In other words, when you hear some fool saying that solar panels take as much energy to manufacture as they ever produce, they are referring to a specific type of solar cells called thin film. A type that was made in the 70s and 80s and only goes into things like calculators. Feel free to ask them to stop being foolish.

Some Math

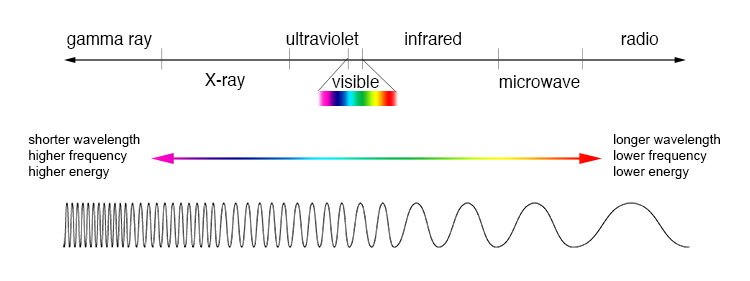
The light we see is not a homogenous single color. In fact, the light we see is not even all the light that is coming from the sun. Infrared and UV rays are also light, but we cannot see them at all. All this light is just an electromagnetic wave. The waves have different wavelengths, but the same speed, and so all the different wavelengths travel together. What we see is a blend of a tiny part of the electromagnetic spectrum.

This is the electromagnetic spectrum. Visible light, what we can see, is only a small part of it.

This is the electromagnetic spectrum. Visible light, what we can see, is only a small part of it.

The amount of energy contained in a photon is equal to

where is the wavelength. h and c are Planck's constant and the speed of light, respectively.

Smaller (shorter) wavelengths give more energy. This is easily shown just by plugging a smaller number into the denominator. Stuff in the infrared is long wavelength, and stuff in UV, X-ray, Gamma ray, etc, are really short wavelength.

Technical Stuff

There is no easy way to do this. I am going to use some terminology that most of you all are unfamiliar with.

A Photo Voltaic (PV) solar panel is a sandwich of two materials. The materials are largely the same, with a few key differences. Both are likely made of silicon (processed sand). But each one has very specific impurities put into them, in a process called doping (not the same type that Lance Armstrong does). This doping is incredibly technical, and very skilled chemists are paid a ton of money to figure out how to do it.

Doping

I won't get into specific materials. Some elements cause there to be a shortage of electrons, or a electron hole, in the whole material (p-type semiconductor). Other elements cause an excess of electrons (n-type semiconductor). So you have one material that can accept electrons, and another material that can give electrons. Putting them together (literally stacking them together) makes magic happen. And by magic, I mean quantum mechanics. Which to most people, including many who study it, is no different than magic.

Just because one has more electrons doesn't mean it wants to be nice and share them. The electron in the n-type literally needs to be excited to be shared. And in PVs, what turns the n-type material on is sunlight. More specifically, photons. Photons are particles of light. ("But Jason!" you say, "Isn't light, like, a wave?" to which I say, "It is both a wave and a particle! Please don't ask me why, just accept it.") Photons contain energy based on their wavelength. Shorter wavelength, more energy (see above).

Here's the fun part. It takes energy to make the n-type semiconductor want to party with the p-type semiconductor. There is a threshold level of energy that needs to be met to kick that electron up from the n-type to the p-type. Too little energy, and the photon doesn't get excited enough to go to the electricity-production party. If there is enough energy from the particular wavelength of light to make that electron jump, then is does jump.

But what if there is more than enough? This threshold level is pretty much determined. Any extra energy will be wasted. This is why PV cells are not particularly efficient. There is a huge amount of light that is too low-energy (all of infrared) for the cell to gather any energy from. There is a lot of light that has much higher energy than required to meet the threshold energy as well. The excess energy is wasted as heat. This can be solved by having a multiple junction cell (multiple junctions just means it has a bunch of different width absorption gaps, so it can harness tons of different energy levels in light). It is capable of absorbing more wavelengths of light, increasing efficiency. And since it has multiple junctions, it is also more expensive and complicated to produce.

Hokay, so, what happens next? You have an electron that has jumped the gap. Then you close the circuit by connecting them with a wire. The electron will go home, back to the n-type, and create an electric charge on its way down. That's about it.

New Methods 

Transistors are expensive. Normal glass optics are relatively cheap. The transistors absorb about 20% of the light that hits them. So it would make sense to use cheap optics to focus more light on the transistors and make the transistors small, yes?

One problem with these cells is how warm they get. If they warm up too much, they begin to lose efficiency. Here we see that we have a tradeoff. We want more optics and fewer cells, but if we do this, they get too warm. They stop being efficient. Some scientists and engineers are working on increasing the efficiency of the cells instead, to get more electricity from light. Otherwise, there are clever ways that some mechanical engineers are trying to get around these issues. One new design uses focusing mirrors and liquid cooling to get around this issue.

The pertinent stuff

Everything pertinent, like insolation and weather, was in the last solar article.

Next post: rounding up some of the stray power sources: tidal, geothermal, wave, and then I am pretty much done.

Thanks for reading.

-Jason Munster

Oil exports and imports

I am going to be lazy this week and post a very short one.

We discussed the Bakken before. It is producing nearly a million barrels a day of oil. This is $100 million in oil sales a day. It costs up to $45/barrel to lift the oil out of the bakken. The Bakken makes profits of about $50 million a day, or about $18 billion a year.

Let's compare this to Saudi Arabia. They pull oil out of the ground for $1 per barrel (it is very efficient there). They make profits of roughly $100/barrel. They produce 12 million barrels a day. In other words, they make $1.2 billion per day.

The US currently imports 11 million barrels of oil per day, and we use a total of 20 million. We transfer about $1.1 billion out of the US per day to drive cars.

What is the end product of this money? Many countries with oil have what is called the "resource curse." It is also known as Dutch disease. It turns out if your country has a ton of natural resources, it becomes inefficient and actually has less growth than it would have otherwise. This has several reasons. First, if a government makes a ton of oil money (or copper or gems), they tend to provide stuff for free to the populace. They take the money they make and just use it to pay for social things, like schools, hospitals, etc. Citizens pay less or no taxes. Corruption and handouts tend to be rife, but since the citizenry gets stuff for free, they don't even care. It is highly inefficient, and the country does not develop a real economy. They often will not use the money to diversify the economy, and once the resource runs out, the country is literally worse off than it was before they found the resource. Finally, having resources tends to allow despotic regimes to thrive. Iraq, Iran, Venezuela,

Interesting, eh? Maybe is a good reason to drive a fuel efficient car. Except that China and India and other developing countries with increasing numbers of cars will ensure every barrel of oil finds a buyer.

One last thing. The US gets its oil imports almost entirely from North America, from Mexico and Canada. The Middle East oil goes to China and the rest of the east. Why does the US spend so much money to maintain peace in the Middle East? Cause if the oil produced there came off the market, the former buyers will have to go elsewhere to buy their oil. Despite the fact that we don't get oil from the middle east, the global price (and our price) is much lower than it would be if war caused the oil to stop flowing from there. So why doesn't China start also enforcing peace in the Middle East? How come the US is the major country to fund this peace keeping? Frankly put, no other country has the experience of the US with having troops on foreign soil. China doesn't yet have the experience to effectively do this sort of thing. But they are already practicing. Eventually, as China continues to rise, they will likely begin to shoulder responsibility of ensuring the flow of oil.

Nuclear Disasters

Nuclear meltdowns are scary things. Most people don't understand what a nuclear reaction is. They just know it is big. Three major meltdowns have occurred: Three Mile Island, Chernobyl, and Fukushima. Most people know about the last two; Chernobyl was a true disaster, and Fukushima still is leaking radiation into the ocean. Fukushima in particular would have been easy to prevent at two stages: building a higher protective wall around the plant, and flooding the reactor early. Zero people died in Fukushima and Three Mile. Compare that to the disaster that is 11,000 premature deaths and 24,000 heart attacks per year caused in the US alone by burning coal. Moreover, modern nuclear power plants are designed to prevent these accidents from happening.

Three Mile Island

Three Mile Island occurred in 1979 in PA. A problem began, and human error allowed it to persist. A pressure release valve was stuck open. The valve allowed some irradiated coolant to escape. A poorly trained operator was not familiar with the interface and confused the warning for the loss of coolant (the human-computer interfaces were new and not well designed). When the reactor began to overheat, the control rods were fully inserted. Remnant decay heat persisted, but the chain reaction was halted. Unfortunately, the plant had its emergency cooling pumps shut down for maintenance. You would think that there would be a rule saying that if the emergency cooling pumps were shut down for maintenance, that the plant itself should shut down, right? Well, there was such a rule. It is one the the key rules that the Nuclear Regulatory Commission laid down. The plant was in violation of this key rule.

A series of events followed where the cladding of the nuclear fuel rods melted. Some radioactive gas was released into the environment. The average person living within a 10 mile radius was dosed with about 8 millirem (a measure of radioactivity). This is the equivalent to a single chest x-ray. The average person living in a high altitude city, like Denver, CO, gets 100 extra mrem a year just by being closer to the sun. The average US citizen gets 300mrem a year from the environment. A round-trip flight from New York to Europe will dose you with 3mrem. In other words, this was negligible. The consensus of epidemiological studies since shows no increase in cancer rates from this event.

One a 1-10 screw up scale, this was about a 6. The operators failed to recognize it as a loss-of-coolant event, and allowed the core to overheat. Not a single person died as a result. All the containment methods, which are 1970s technology and design, worked. The only loss was an economic one. To the tune of about $2 billion.

Chernobyl

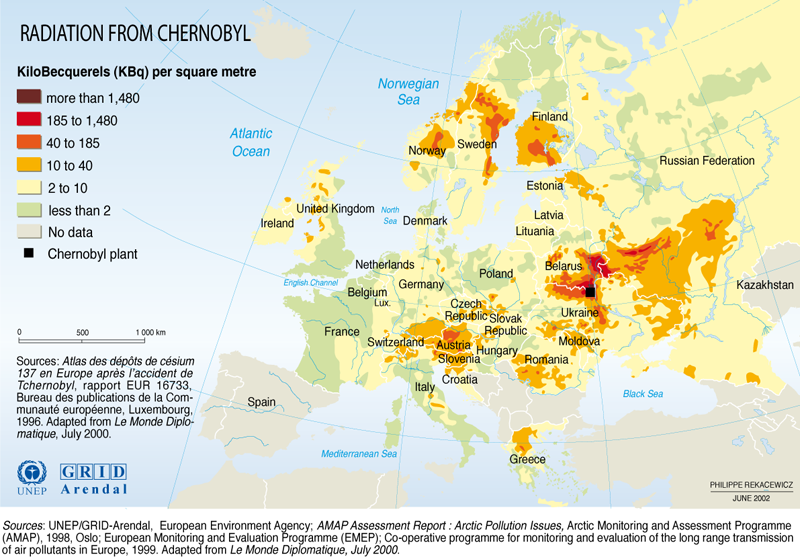
Location of the Chernobyl plant, and the spread of radiation contamination afterwards

Location of the Chernobyl plant, and the spread of radiation contamination afterwards

Chernobyl. April 26, 1986. A real, unshielded nuclear meltdown occurred. Chernobyl did not have the containment building that most other reactors had. In other words, outside of the reactor pressure vessel, there was nothing to contain leaks or explosions. 31 people died that night, and most serious epidemiological studies indicate the total death toll (counting increased incidences of cancer) has caused about 5000 premature deaths in Europe to date. Total increase in cancer by 2065 is estimated to be about 40,000 (not all of these lead to death). Let's be very clear on this. The worst nuclear disaster in history, which has proven to be avoidable just by building a concrete building around it, will have caused 40,000 cancer-related premature deaths in 80 years. This also happens to be the sum total of deaths caused by nuclear. If you look at actual deaths caused in the US alone by coal in the past 80 years, you are looking at numbers close to 1.6 million (about 20k deaths annually in the 70 years prior to strict limitations in 2004, 11k annually since then). This is a conservative estimate, not accounting for likely increase in death through the years when there were no emissions limitations. The number of heart attacks caused by coal emissions over this period is likely double this. Also compare those 40,000 increased cancer incidences to the literally hundreds of millions of unrelated cancer cases that will have occurred over that same 80 year period in Europe alone. 40,000 compared to 1,600,000, the latter produced in an era of much lower population, is pretty staggering. These numbers speak for themselves. Also compare this to the 17,000 deaths that have occurred from airplanes in the 13 years of 1999-2011.

Now that we know the death toll of Chernobyl, and we have a comparison of other deaths, let's talk about this catastrophic failure. It was a very complicated series of events, one that I could write several posts about. Instead, I will direct you to the Wikipedia article. The short version is that they were running some safety tests. They were instructed by Kiev to hold off their tests by 12 hours, making the test run during the overnight shift instead of the shift that was trained to run the test. At the end of the safety tests, they tried to insert the control rods back into the core. Because of several anomalies caused by having moved the test time, there was a minor explosion in the core as the rods were inserted. They were only 1/3 of the way in, and they broke off, preventing full insertion. Unlike modern control rods, these control rods were made of graphite. Graphite is a good moderator, but it also burns really well at high temperature. The lack of control rods allowed a small nuclear chain reaction to happen. This reaction was self-limiting; the energy from the reaction blew the fuel rods apart, making it so there was not enough uranium in one place to continue the reaction. The explosion, however, ripped through the pressure vessel and allowed atmosphere to come in. Air contains O2. Graphite is carbon. Carbon is what burns in coal to produce heat. The heat of the overheated reactor combined with the influx of oxygen was enough to make the graphite burn. This helped spread out the radioactive material. There was no giant concrete containment structure to contain it (remember how Three Mile island had a containment structure, and it worked? So did Fukushima.). The burning graphite spread radioactive material very far.

On a 1 to 10 scale of screw up, this was a 10. Bad idea to do safety tests.

Fukushima

The reactor that blew. https://share.sandia.gov/news/resources/news_releases/images/2012/Fukushima.jpg

Fukushima is still being studied. The latest reports indicate that people living within the immediate vicinity of the plant received 10mrem dosing. Again, this is the dosage a person gets every 10 days just for living on Earth. There have been no increases in cancer, nor is there expected to be any. There are some serious ecological impacts to be dealt with. There are some regions in the immediate vicinity of Fukushima that won't be able to produce agriculture for as much as 20 years. Other areas are uninhabitable for that amount of time. The region groundwater around Fukushima Daiichi is still contaminated and likely will be until a 100 foot deep wall of concrete and steel is built as a containment wall around it. It still leaks radiation into the ocean today. Nonetheless, no one has died from the incident. It could have easily been prevented in two circumstances. An event like this wouldn't even be possible in a modern nuclear power plant, as we will see.

Fukushima Daiichi's emergency backup generators kicked in after the 9.1 magnitude earthquake shut down the power grid. The ensuing tidal wave washed over the protective barrier of the power plant and inundated the generators. They shut down. The emergency backup batteries lasted 8 hours. Then cooling pumps stopped. This is known as a triple power failure. It is something that had been written about in the past for many plants, with measures taken against in. It was something written about with this particular plant, with no measures taken against it. TEPCO was warned by a governmental agency two years prior to this event that their sea walls were not tall enough.

Fukushima Location. http://www.cdc.gov/niosh/topics/radiation/images/JapanMap.png

What happened next is that the core melted down. They should have flooded the core with seawater and destroyed the reactor (seawater is pretty corrosive), but the plant operator thought they could contain the situation without destroying the reactor. They were wrong, and the consequences were a full nuclear meltdown. Heat and pressure built up and the explosion could not be easily contained. The surrounding area had to be evacuated. Even in all of this mess, no one was exposed to sufficient radiation to matter, and the situation is handled. It is an environmental disaster, yes. But let's compare this to coal fired power plants. Where do you think all that mercury in the fish over the entire planet comes from? Coal fired power plants.

More importantly, the new generation of power plants would prevent this type of event from happening. The emergency cooling water reservoir is contained above the core. In the event of power loss, the water can dump into the reactor using gravity. No Fukushima, no explosion and radiation.

This post is getting long, but before we go, let's visit one point we have touched on. Nuclear power has risks. Coal power has definite consequences. Far more people die from coal than from nuclear power. Grossly more. Nuclear is still scary to most people, and likely not to win the PR battle in the short run. And all these safety features make nuclear power pretty expensive. What are the other options? We haven't discussed hydro yet, nor wind and solar. For now, let's leave it between the big power plants. I personally believe that Fukushima was the last major learning point in nuclear power. Coal power is pretty gnarly, even at its best. Another solution is to use less energy. This is pretty tough one to make happen, and I don't see it happening any time soon. A post far in the future will grapple some of this.

That's all for now. Thanks for reading my longest article to date.

-Jason Munster

Hydraulic Fracturing!

Fractured Shale and pipe

Schematic of what hydrofracking does to the surrounding rock. Source

This is one of my favorite topics! Hydrofracking (short for hydraulic fracturing) is used to extract both natural gas (Barnett and Marcellus Shales) and oil (Bakken Shale, a few other places) from regions that used to be too dense to extract hydrocarbons from, or that would otherwise not produce much.

These dense rocks, called “tight formations” (formations meaning rock beds, tight meaning not having connected holes) are not permeable enough for hydrocarbons to move out of them at high flow rates. (Permeability means fluids can flow through something. Paper towel is permeable, plastic is not.) Believe it or not, many types of rocks are very permeable. They have lots of interconnected cracks. Shale is not such a rock. It may have space inside it with oil or gas, but these spaces are not connected by the cracks that would allow these hydrocarbons to flow out to a well. A well drilled vertically into this shale would produce almost nothing. These hydrocarbons stayed in the ground. Hydrofracking changed that.

Hydrofracking

Hydrofracking, in short, is exploding cracks and holes in the ground with shaped charges and water and then pounding sand into those holes. Hydrofracking requires 2 to 3 million gallons of water and 2 to 3 million pounds of sand per well.

Hydraulic Fracturing first requires drilling a hole in the ground. These holes can be kilometers deep. The advent of horizontal drilling allows for drilling horizontally by bending the steel tubes of the well. Sounds crazy that steel can bend? Given 300 feet of pipe, the steel pipes can bend  at a right angle. Horizontal drilling can cost up to 4x what normal drilling costs, so it is only used in places where it can greatly increase production. Like hydrofracking applications, where it makes a well go from zero production to up to 2000 barrels of oil per day.

This is where the magic happens. Formations that hold oil and natural gas are often horizontal. First a vertical well is drilled, then it goes horizontal for up to 10km. For hydraulic fracturing, shaped charges are planted inside the pipe in the horizontal section. They are then directionally exploded into the rock, creating large cracks in the rock extending away from the pipeline.

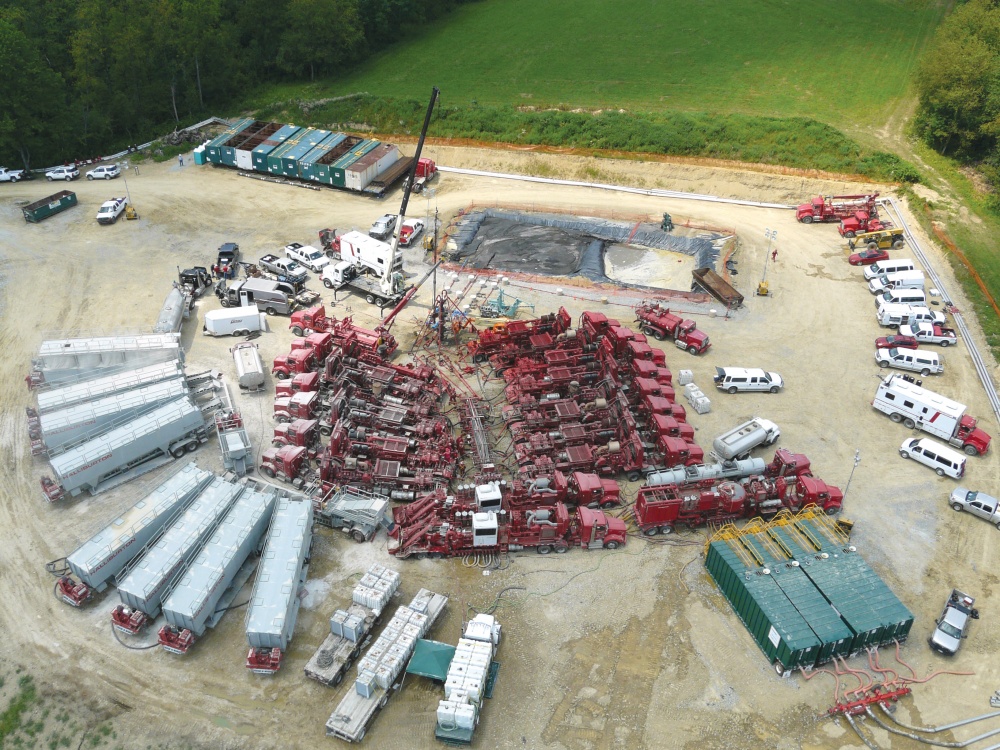
Next they pressurize a viscous fluid and cram it into the drilled hole using dozens of pumps to create massive pressure. This process can take dozens of trucks work of fluid, pipelines, and pumps. The trucks gang-pump fluid into the hole. The fluid finds the cracks in the pipe and rock made by the shaped charges. The fluid rips through the rock, rending the cracks, expanding them in length and volume and connecting them. These cracks become very widespread. The former tight shale or sandstone formation that prevented the flow of fluids is now a series of connected cracks leading to the pipeline. Fluids can flow.

Hydrofracking pump trucks

Dozens of hydrofracking trucks pump hydrofracking fluid into the hole. Source.

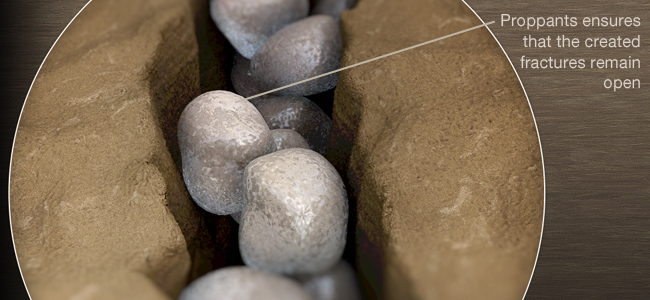
When the hydrofracking fluid is drained, the cracks can close up again. To prevent this, something called a proppant is used. A proppant props open the cracks, much like leaving a door stopper in your door. Typically sand was used for this, but new proppants with special shapes and properties are being used as well, like ceramic beads covered in resin for deeper wells. The proppant is put in at the same time as the hydrofracking fluid. When the trucks reverse the flow of hydrofracking fluid and pump it back out, the proppant remains behind.

Fracking Proppant

Proppants hold the cracks open after the hydrofracking fluid is drained. Source

Proppants hold open the rock and allow flow, but this is not permanent. Flow reduces over time. The first year after hydrofracking happens is the most productive. Drilling and hydrofracking a hole, then closing it, reduces the hydrocarbons you will get out of the hole compared to drilling and pumping. If you frack a hole and then close it, the hole will ultimately produce a lot less hydrocarbons than if you drill and pump. In other words, once you have fracked, you gotta make use of that hole or you will lose a lot of money.

Natural Gas hydrofracking

Natural gas hydrofracking in the US is one of the more polarizing topics. The chemicals in fracking fluid are of such low concentration that it does not matter if it gets in the local water supplies. But they mix concentrated versions of these incredibly toxic chemicals into the fracking fluid. In other words, the fracking fluid may not be toxic, but the pure chemicals they keep on-site to mix into these trucks sure are. If any of this leaks into the environment (it has), it can be quite damaging. One can hope that this sort of thing is both rare, and well-controlled in the future.

There is the leaking associated with hydrofracking for natural gas. Howarth (2012) estimated there is an upper limit of 8% of methane leaking from natural gas extraction and transport for hydrofracking. Given the factor of 23 greenhouse warming potential of methane, this is a problem. Compounding the problem is that mineral and resource policy are states rights in the US.  NY and PA do not have the law history in place or the resources to figure out how to deal with the potential pollution from fracking, nor the resources to enforce the policy. This, in part, is why fracking has been stalled in the Marcellus in many places.

Oil hydrofracking

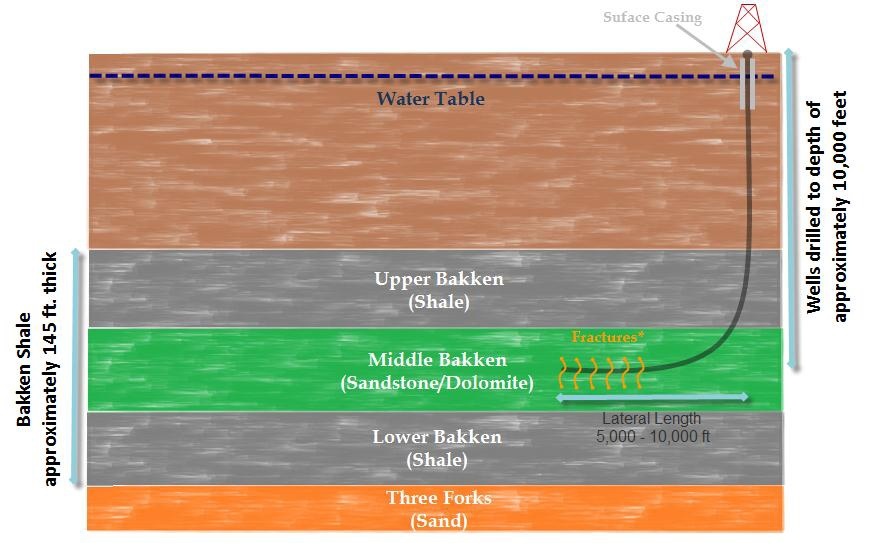
The Bakken formation. Here the sandstone contains the oil. It is sandwiched between two impermeable layers of shale.

The Bakken formation. Here the sandstone contains the oil. It is sandwiched between two impermeable layers of shale.

There are other important implications for fracking specific to oil production. In order to drill, a company has to lease drilling rights. When a company leases drilling rights, they have obligations to produce certain amounts of hydrocarbons within a short time-frame, or they lose the lease. So they drill. A lot. Remember how we talked about holes losing productivity over time? Once a fracked hole is open, they are unlikely to close it. The problem? In the Bakken shale, they co-produce natural gas with oil. There is no infrastructure to pipe the natural gas away. They burn it instead. Some of it may leak. In other words, they are producing massive amounts of pollutants and GHGs. North Dakota does not have the ability to quickly build infrastructure to capture and transport this natural gas. And North Dakota doesn’t quite have a population that is accustomed to or capable of having a lot of bureaucracy to deal with these issues and enforcing policy. It’ll be a while before this is handled. In the meantime, North Dakota will light up the night sky like a mega-metropolis.

Bakken at night edit

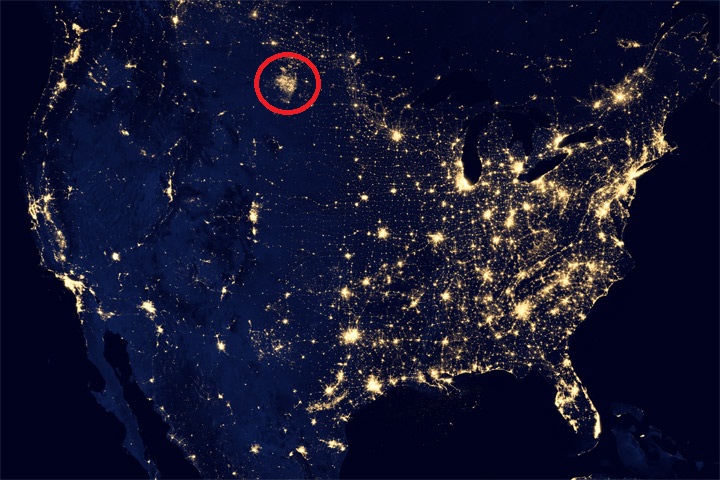
The flaring of natural gas 24/7 in Bakken makes North Dakota look like it has one of the largest cities in the US. If you look at the picture below, you can see a stark contrast.


That light in North Dakota didn't used to be there. Courtesy Nasa

Implications

You may have heard that Hydrofracturing for natural gas is a phenomenon that is not repeatable outside the US. This is untrue. It likely cannot be repeated in Europe, but China is just discovering shale gas deposits that could rival or outsize that of the US. There are also likely large deposits in Africa. As far as shale oil goes (not to be confused with oil shale!), it is also likely available outside the US. We are just really good at getting stuff out of the ground here.

You may have also heard that this could make the US energy independent by 2035. If we don't grow our appetite for oil, this could possibly happen. It is unlikely, but that is a topic for later. The US is already one of the largest producers of oil on the planet. Is this a good thing? It is a mixed bag. It will definitely be a boon to the economy if we are not sending nearly $1 billion a day overseas to satiate our demand for oil (we use 18 million barrels a day in the US, importing 10 million of those @ $100/barrel, or a billion dollars a day). It would not prevent the middle east from getting a ton of money from oil still, as Asia and Europe will still buy all the middle east oil. It likely won't decrease the price of gas in the US, since any increase we make in production will be matched or outstripped by increased demand in China (1.3 billion people), then India (1.2 billion people), then Africa (2 billion people) in the 2nd half of the century. In other words, it won't change much on a world scale. Producing this much oil domestically also will keep the US addicted to oil, rather than transitioning to cleaner energy sources and more rational lifestyles that don't burn tons of resources. But the whole quarter of a trillion dollars per year that we aren't sending overseas, if handled properly, could easily boost our economy and help subsidize our way out of oil addiction. It's clearly a thorny topic, and beyond the scope of this post.

Conclusions

Fracking will change the energy landscape in the US by providing a lot more natural gas and oil domestically. It has downsides, from increased flaring of natural gas to domestic pollution, but it does have upsides that can be harnessed for the good of our future.

Natural Gas Price Drop, and Natural Gas Electricity!

Today’s post is about the shift in US primary energy use from coal to natural gas (AKA methane). Hydrofracking, the hydraulic fracturing of rock to subsequently produce natural gas, is a new favorite pass-time in the US. Natural gas prices used to track oil prices per unit of heat. They now roughly track coal prices per unit heat. As a result, it is now economical to produce electricity from methane rather than coal. As we discussed before, coal produces a whole bunch of dirty pollution, and methane does not. All good, right?

This is very important for both CO2 emissions reduction and for reduction of other pollutants. The math section is chemistry heavy. If you are going to skip a math section, this is the one.

The highest grades of coal have composition , and lower grade coal is All coal is tainted with mercury and other heavy metals. Lower quality coal has more pollutants per unit heat, and this produces more pollution for the same amount of electricity. From the last post, we learned burning coal has quite the array of negative health effects.

The chemical composition of natural gas is CH4. It contains almost no other pollutants. It doesn’t produce particulate matter. When it is burned to produce electricity, we do not have the direct adverse health effects associated with coal. What about the CO2 emissions? These are reduced. Cause of math.

The Math of Chemistry! This is bond enthalpy chemistry. (Feel free to skip ahead if you don’t like the math parts)

Let’s look more closely at the composition of these two things. When any substance burns, it produces heat by converting everything to H2O and CO2. The resulting H2O and CO2 have lower internal energy than the coal or methane that formed them. The difference in energy from the coal to the H2O and CO2 has to be given off as heat.

Before the math: First, what is a mol? It is short for mole. Pretty bad abbreviation, eh? A mol is the number of molecules it takes to make one g times the molecular weight of the molecule. It is molecules. This is confusing. Lets use examples to make it less confusing. Hydrogen has a molecular weight of 1. A single mole of it weighs 1 gram. CH4 has a weight of 16 (12 for the carbon, 4 for each hydrogen). A mole of it weighs 16g. CO2 has a molecular weight of 44, and a mol of it is 44g. Done.

The amount of energy used to hold atoms together to make molecules is the bond energy. Chemical reactions happen, chemical compositions are changed. If the overall energy of bonds are lower after the change, heat has to be released. This creates fire.
Bond energies: C-C bonds (aromatic, the ring-type found in coal) have 519 KJ/mol. C-H is 410. H-O is 460. C=O (double bond) is 799. O=O are 494 KJ/mol.

We simplify coal as aromatic bond chains of 4(-CH-) (this is generous in terms of calculating CO2 produced per unit coal, as all my prior calculations have been) (I stole this clever approach from my advisor, Jim Anderson, to simplify things). CH4 is pretty easy as CH4.

We can write these as:


The molecular weight of our coal is 4*(12+1) or 52. Methane: 12*1+1*4 = 16

Coal: We break four C=C aromatic bonds (only four cause we would be double counting if we did each side of (-CH-), four C-H bonds, and 5 O=O bonds. We form 8 C=O and 4 H-O bonds.
Methane: 4 C-H bonds are broken, as well as 2 O=O bonds (the two O=O bonds are from converting the 4 H bonds into H2O). 2 C=O, and 4 H-O bonds are formed.

Coal: 

Methane: 

Math done!

The changing landscape of energy production based on cheap NG

Back in the day (pre-2010 or so) natural gas was much more expensive per unit heat than coal was. If you were going to burn something to produce electricity, coal was much cheaper and so produced cheaper electricity. The fact that it was pretty dirty didn’t matter as much. Then hydrofracking happened. Natural gas got cheap. Its price once roughly tracked with but below oil. Now it tracks with coal. This makes it a viable alternative to coal in power production. This fundamentally alters the primary energy landscape in the US. Once more data is available, we will revisit this.

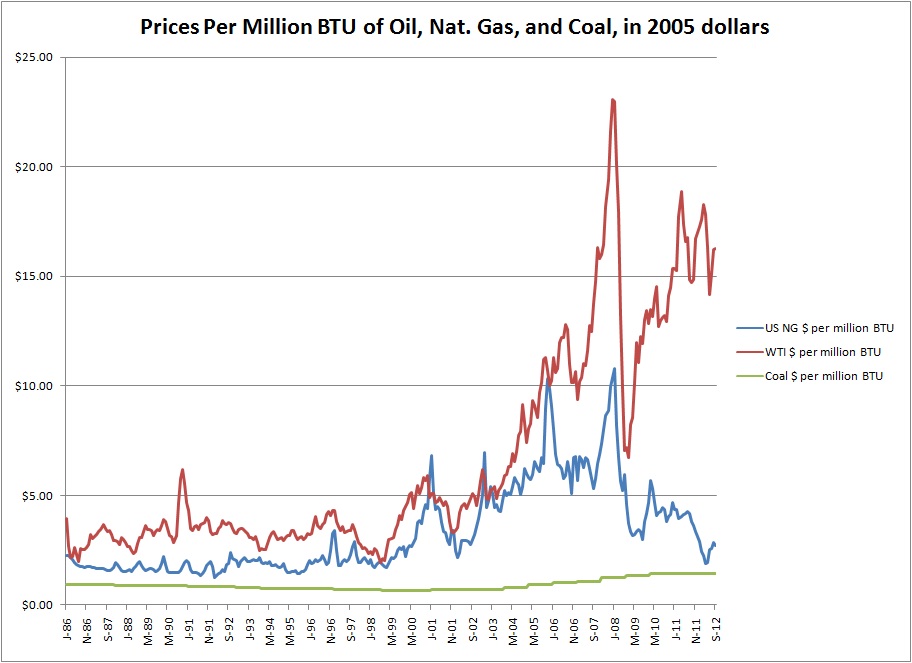
Hydrocarbon Prices 86-12

Historic hydrocarbon prices per million BTU. Natural gas roughly tracked with oil, until hydrofracking made a glut in the market

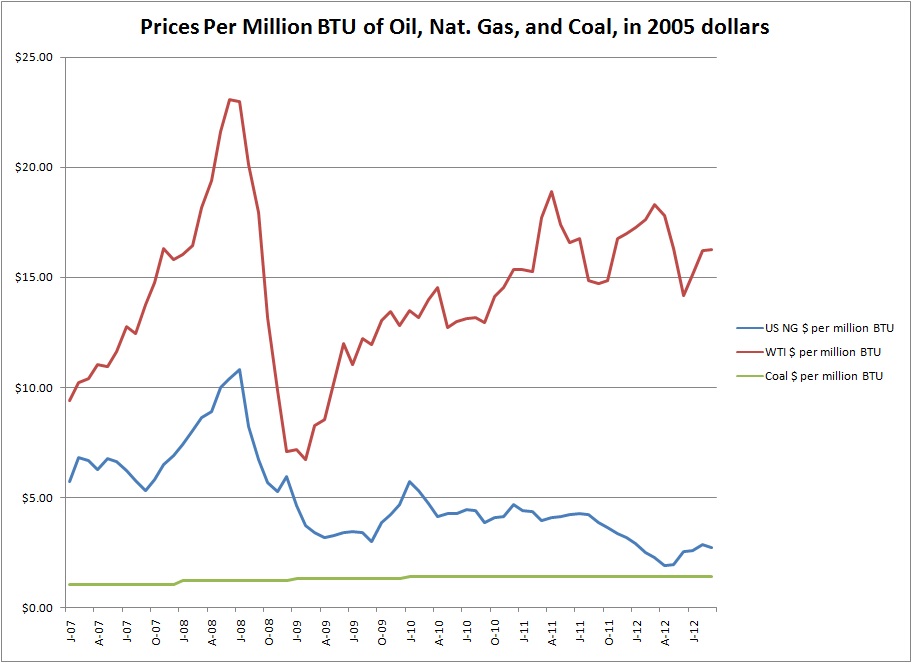
Hydrocarbon Prices 07-12

Zooming in on the recent few years, the divergence of oil and gas and convergence of coal and gas becomes evident


Let’s discuss policy and environmental implications. They are pretty huge.

The math shows that in energy per unit CO2 produced, methane is about 60% more efficient than coal. This means that if we have to burn either methane or coal, and we seek to limit CO2 production, methane is the natural choice. Historically pricing prevented this from happening.

Natural gas is now only slightly more expensive per unit heat than coal. It makes sense to make electricity from natural gas, cause it produces far less pollution per unit heat. Since 2008, the US has reduced the amount of CO2 is produces for the first time in a long time. The reduction of CO2 produced by the US is partially based on this change in natural gas price. We now produce more electricity from methane than we used to. Since methane is more efficient at producing energy per unit CO2 produced, we produce less CO2 as a country.

Many staunch environmentalists argue this is a bad thing. Natural gas is still a hydrocarbon and still produces greenhouse gases. It kills far fewer people directly than coal does. The deaths that came as a result of coal might have pushed us towards a much greener economy. Methane is the lesser of two evils. It produces energy like coal. It produces CO2. It is still a finite resource. It is much better than coal.

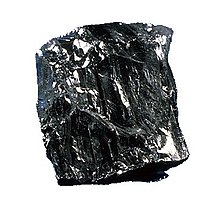
Coal: The great of two evils between coal and methane. A picture of anthracite coal to break up the monotony of a text well. From Wikipedia.

Barring legislation to prevent hydrofracking, this trend of cheap NG will continue for a long time in the US. We have massive reserves of natural gas in our shale, and hydrofracking can get it out. This is not limited to the US, but there are only a few countries in the world that will be able to do this.

Before closing, we have one last thing. Many of you looked at the graphs of natural gas prices, saw that they were historically not much higher than coal for many years, and wondered why we didn't have natural gas electricity plants then. There are two answers. The first is that we did. It is why we have so many right now that can instantly go online. The second answer is that the EPA really only started getting strict on coal plants in 2004. The emissions from coal plants add many costs that go beyond the price of coal. Natural gas is pretty clean, so it doesn't face these costs, making it more competitive with coal.

Summary: Hydrofracking in the US has changed the natural gas price to be much lower and has made it a basic energy feedstock rather than a premium one. The US has natural gas power plant capacity, and has started shifting to electricity from natural gas. These power plants produce less harmful emissions as a result. CO2 emissions are reduced for the same amount of electricity. Harmful pollutants that cause heart attacks, asthma, and early death are also reduced. This is pretty huge.

Thanks for reading again, and sorry for the huge length

Jason Munster

* Will pointed out that I had Avogadro's # off by a factor of 10. Fixed

Coal Power Plants

Expect a lot of updates on this post. Thanks to Buck Farmer, who told me that I needed to learn LaTeX to make this prettier.

COAL FIRED POWER PLANTS

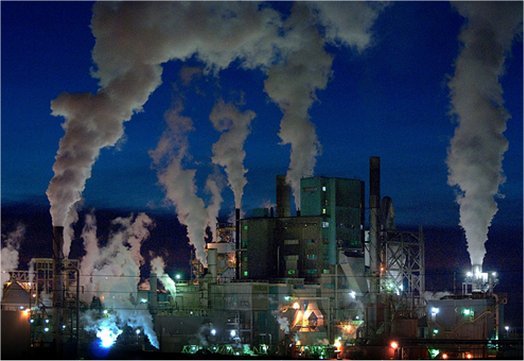
A coal fired power plant.

Coal fired power: it provides a lot of our energy, is less expensive than petroleum by far, makes cheap electricity, and causes all sorts of health ailments and pollution. Coal power plants produce particulate matter, sulfur pollution, and other pollution, resulting in deleterious health effects.

Coal fired power plants provide a huge chunk of the world’s energy. It provided almost 50% of US electricity in 2009. Today, the math section is a review of how much energy is in coal, how much coal we need to operate a single power plant, and how much coal we need to operate all the coal fired power plants in the US and China.

The topic of coal fired power plants used to be simple. Thanks to fracking, natural gas prices are now approaching coal prices. This post is written with 2009 information. It is largely relevant today, but this landscape may change in a few years as more power is produced via natural gas in the US. Suffice it to say that natural gas has become considerably cheaper in the US:

Oil be getting expensive, NG be getting cheap!

The price ratio per unit of heat in natural gas prices compared to oil in the US. The ratio used to be around 1. Now you get a lot more heat out of natural gas per dollar, thanks to the abundance from hydrofracking.

We will discuss this more in a future post.

Maths! Warning, this is pretty shocking!

High grade coal has an energy density of about 32MJ/kg (For our math, lets assume the best coal is used everywhere. In reality it is about 24, so my world with coal is 33% nicer than the real world). Compare this to a gallon of gasoline, from my very first post, at 120MJ. A gallon of gas weighs about 3kg, with an energy density of 40MJ/kg, slightly higher than coal, or nearly twice as high an energy density of a majority of coal.

A watt is a joule per second. A megawatt is a megajoule per second. A coal fired power plant can produce 1GW per second, which would be a gigajoule expended per second. But remember from our thermal efficiency post, these powerplants are not all that efficient! Let’s say a coal one averages 35% for thermal efficiency.


Coal_eqn1

31.25kg of coal used per second to produce 1GW of heat! But remember from the thermal plants post, thermal plants tend to only be about 35-40% efficient!

Coal_eqn2

A 1000MW coal fired power plant burns nearly 200 lbs of coal PER SECOND to provide power. That is my weight in coal for every second.

Let’s continue blowing your mind. There are 86,400 seconds in a day, yes? (yes).

Coal_eqn3

2.8 megatons of coal per year for a single coal-fired powerplant! Okay, 200 lbs. per second leaves a bigger impression. Here is another way to look at it. How much coal does it take to keep a 100W lightbulb lit for a year?

Coal_eqn4


280kg! Per year! This is about 2 lbs. of coal per day to power a 100W lightbulb. “But Jason,” you say, “We don’t get all our electricity from coal!” This is also true. We get almost ½ of our electricity from coal. But say ½ is from coal, the other ½ is from hydro power. If you turn off your light, we get back the ½ from coal, saving a pound of coal from being burnt. What about the ½ from hydro? Welp, that can go and power another light. The ½ of the light that would have been powered by coal. So yeah, even though ½ of our power comes from coal, the opportunity cost of using that light is the equivalent of getting all of it from coal.

Let me repeat that. If you have a 100W incandescent bulb, and you leave it on for a day, you just burnt 2 lbs. of coal. Good job. If turning off your lights to save on electricity is not enough to get you to shut em off, just picture that much coal burning to keep that light on. Your laptop computer uses about 2-3 pounds if it runs the entire day. Your TV, if left on, will burn more like 10 lbs. of coal a  day.

One last part. China provided 500GW of coal power provided in 2012. The US provided 200GW in 2009 (note: thanks to shale gas and fracking and using the gas to produce electricity, the amount provided by coal has dropped!). 200GW of coal power in the US means 600 megatons of coal per year in the US using our numbers, and 1500 megatons of coal in China. And remember, my numbers are rosier than the real world.

Turn off your lights.

The qualitative stuff!

Emissions from coal-fired power plants, and health trade-offs

Smog. Not fun to breath.

Burning coal emits sulfur (which can be mitigated through special filters, but often is not), CO2, NO and NO2, mercury (also can be mitigated, usually is in the US), other metals, and fine particles (called PM2.5 and PM10 for Particulate Matter of radius 2.5 microns and less, and radius 10 microns or less, respectively). Sulfur causes irritation and lung problems, smog, and acid rain. CO2 and NOx contribute to global warming, NOx also to smog. Mercury emissions are the reason we can no longer eat fish every day. PM2.5 causes cancer, asthma, and severe lung problems. Coal power plant emissions can lead to ozone at ground level, which causes smog and serious respiration issues.

Later we will discuss black carbon vs. sulfur here, since they have opposite effects on regional warming vs. cooling. Today we discuss the health effects of a coal fired power plant.

In the US, where coal-fired power is relatively clean, it causes tens of thousands of deaths per year. It causes hundreds of thousands of heart attacks, asthma attacks, ER visits, and hospital admissions per year. A compilation of EPA and heavily peer-reviewed articles estimates 13,200 deaths and 20,000 heart attacks were caused by coal-fired power plants in 2010. In 2004, before the EPA starting getting aggressive, these numbers looked like 24,000 deaths per year in the US.  The rate of asthma is drastically increased in the area of coal fired power plants. The US even then had relatively stringent requirements on power plants. When you factor in the population and lax controls of countries like China and India, I have heard estimates of premature deaths caused globally by coal fired power to be in the millions, and even larger numbers for asthma.These adverse effects are much more likely to be caused by the wealthy regions that use more electricity per capita than the poor regions that host the power plants and the adverse effects. In other words, the electricity used by large mansions in wealthy neighborhoods often comes from powerplants placed near poor neighborhoods.

The coal used by the US and China directly contribute to global warming on a huge scale. In a future post that describes the composition of the atmosphere and how greenhouse gases work, we’ll get directly into those numbers.

Satellite image of pollution in China. From: http://earthobservatory.nasa.gov/IOTD/view.php?id=76935

Beijing's got a bit of a particulates in the air in the winter. I was in an airplane in Beijing on this day. They announced "The fog is too thick to take off." Except it was below freezing and the air was dessicated, making fog unlikely.
A more clear day near Beijing


Let’s be pragmatic for a second.What’s worse than deaths and heart attacks caused by coal-fired power? Not having electricity to power your hospitals and other vital services. If you are a poor or developing country that can’t afford fancy nuclear or renewable electricity, and you don’t have access to hydro power, putting up a coal plant to power cities enough for basic services is a no-brainer.  Wealthier countries have a choice: suffer the pollution, or spend more money and avoid it by building more expensive yet cleaner electricity sources. The US as a whole can easily afford to do this. Pakistan and India? Not so much.

Take-aways: Turn your lights off, they require a lot of coal. Avoid breathing or raising children near coal-fired reactors.

-Jason Munster

Base load electricity vs Peak Load

Base load Electricity vs. Peak Electricity

I was writing a post about how a coal fired power plant works, and then realized that I needed to describe more about our electrical power grid and how each power component fits into it. Also, speaking of power grids, there is an excellent game called Power Grid that anyone who knows me should come over and play.

Base load electricity!

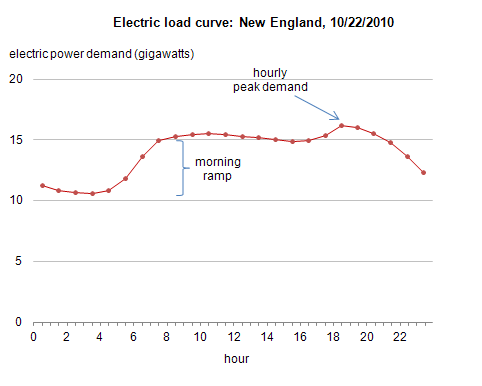
Electricity_demand_profile_NE

Pictured above is the electricity demand for an October day in New England. Notice that throughout the middle of the night, the electricity demand is roughly 10GW. Throughout the day it ramps past 15GW. Base load electricity in this case is 10GW. It is the minimum amount of electricity needed at any point. All power plants that provide base load electricity will run 24 hours a day. Base load power plants need to be very reliable so they don’t shut down unexpectedly.

Base load electricity requirements do change throughout the year. During the sweltering summer in southern states, air conditioners are constantly on, drawing more electricity in the summer. In some countries, there is not enough base load electricity to provide electricity in the worst months. In Pakistan, for instance, there will not be viable electricity more than 4 hours per day for several months. We will return to base load electricity soon.

Peak electricity is whatever is above base load. In the above figure, it is the all the extra stuff from 10GW to 15GW. Peaking power presents special challenges, because it can be unpredictable. If the temperature is several degrees warmer in a summer afternoon, the peak electricity requirements can be greater than predicted. Power plants that are capable of ramping up power quickly will compensate for peak electricity demand. “Ramp Rate” is the MW per minute a turbine can spin up at. This ramp rate is important, and we will get back to that almost immediately.

A brief interlude on cost! Base load electricity tends to be pretty cheap. A base load plant will not get paid as much for electricity. Peaking plants are designed to turn on only when electricity is more in demand. This means they get to charge more! A peaking power plant will figuratively not get out of bed in the morning for less than 50% above base load electricity rates.

Okay so here is where things get somewhat more complicated. Some power plants can never be taken offline in short order (think nuclear). Thermal power plants tend to take longer to create enough heat and steam to spin up their turbines, including both coal and nuclear, and some types of natural gas. Anything that takes a long time to spin up is meant for base load power.

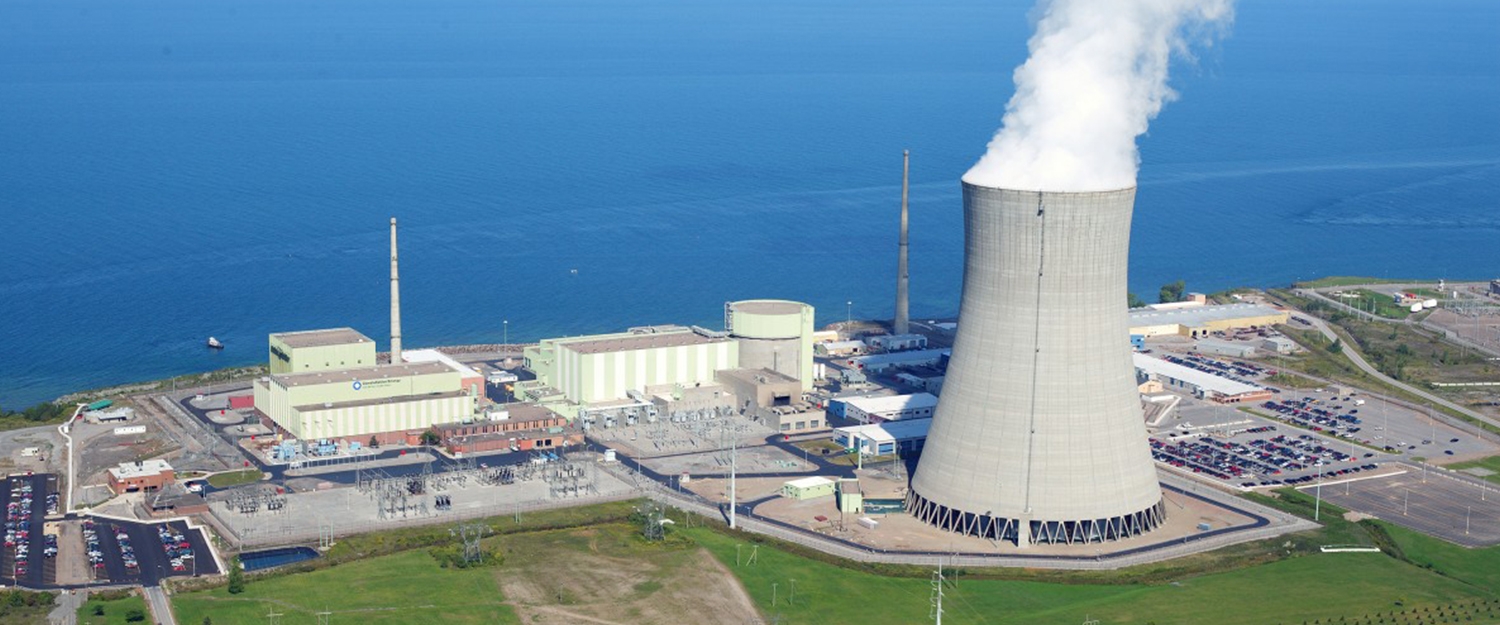
A nuclear power plant with the nuclear plant (small rectangle buildings and one cylindrical building) and a cooling tower (big steaming parabolic-shaped tower). Nuclear power plants never shut down, except to change fuel rods.

A nuclear power plant with the nuclear plant (small rectangle buildings and one cylindrical building) and a cooling tower (big steaming parabolic-shaped tower). Nuclear power plants never shut down, except to change fuel rods.

Other types spin up very quickly. For some, like natural gas plants that are designed to deal only with the peak electricity use, a typical turbine can ramp at a massive 20MW per minute (most plants have several turbines, and can ramp at multiples of 20MW!). Why don’t we use these for base load, since they seem so flexible? These fast-ramping systems are not designed to be always-on. They accrue damage if they do not have downtime.

Let’s talk about renewables. A power plant has to produce either base load or peaking electricity on demand to be useful. We have the magic of hydro electricity. It combines a very high ramp rate, and also capable of maintaining base load electricity.  Wind and solar at first seem terrible. They only work when the wind is blowing or when the sun is shining. So they cannot provide either base load or peaking electricity, right? Fortunately, this is not correct. Due to complexities we will discuss in later posts, wind and solar can be installed and paired with each other and with other tech to produce somewhat reliable base load electricity or peak electricity.

One example? When does electricity demand peak in the summer?

If you said when it gets hot and air conditioners work harder and draw more electricity, you are onto something. And it gets hot when the sun shines. Put some solar panels on your roof, and you see your solar panel electricity production rise coinciding with your need for more electricity for house cooling.

Every power plant type has important considerations for peak load vs. base load. As we look at each in turn, it will become apparent how important this distinction is.

One last thing before closing. How do power plants figure out when to turn on? In New England, we have a group called ISO New England. It projects electricity demand based upon yearly trends (people consume a ton of electricity over holidays, and at different time periods!) and upon weather forecasts. Each day, every power plant puts in a bid for how many cents per kilowatt hour they need to turn on. In other words, it’s the figurative “price per kwh to get out of bed.” If demand is projected to rise to such a point that the bid for a plant is met, that plant will turn on once the price hits that. This is confusing. Let’s use an example.

We have three power plants in our imaginary tiny country. Since I keep bringing up this country, I am going to call is JasonLand (for now). JasonLand currently has a coal fired plant, a nuclear plant, and a natural gas plant designed for peaking. The nuclear plant cannot shut down. It will literally bid -$0.50/kwh to  ensure that no matter how low the price is, it will produce electricity. Our coal-fired power plant is baseload, but will shut down on days when it is not needed. It will bid $0.07/kwh. As soon as the price rises above this, it will start up (this is simplified, starting a coal power plant takes a long time). Our peaking gas plant will bid in at $0.11/kwh. Once people get home and need more power, or when it is a really hot day, our peaking gas plant will spin up its turbines rapidly.

So how do these bids work? How much does each plant get paid? As demand rises, price rises, and the power plant earns more for every kwh. Our nuclear power plant will make a small amount in the middle of the night, and make more during the daytime. I’ll leave you to ponder why a power plant would choose to not run until a certain payment threshold is hit.

Because I can’t help myself, let’s close with a tiny bit of math. A realistic price for energy in New England is about $0.15/kwh. To make it easy, let’s convert to $150,000/gwh*. A nuclear plant is about 1gw. It will produce 24 gwh of electricity in a day. That is $3,600,000 in revenue per day. Every week it earns nearly $25 million. I hope at this point any regular reader is beginning to get a sense of how staggering numbers associated with energy use are.

Thanks for reading again!

Jason Munster

*Correction: original post was a factor of 10 short.

Powerplants, Primary Energy, and Electricity!

Power Plants! Primary Energy vs. Electricity!

Energy and electricity are the backbone of our civilization and economy, right?  (Hint: the answer is yes) How do we get all this electricity we got kickin’ around? That’s a pretty complicated topic. This is gonna take a few posts, but we’ll get there. Today is energy and electricity, and how they relate. Later will be a more detailed look at some power plants. I don't think most people will want to skip the math section this time, as it is both interesting and kind of fun.

First, The Math!

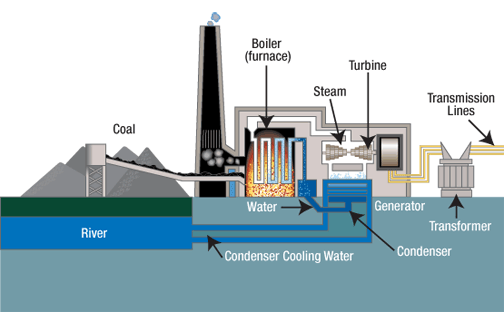
The great bulk of our electricity generation amounts to complicated ways to boil water. Even nuclear plants generate electricity by harvesting the heat of a nuclear reaction to boil water. In all these power plants, application of heat turns that water into steam. That water to steam thing expands the water a whole lot and creates positive pressure (and thus wind) to drive a turbine. Driving a turbine spins a coil of metal in a magnet, converting mechanical energy into electric energy.

Picture!

Block diagram of a coal / thermal / steam / fossil fuel power plant. Source is TVA website (government authority that built powerplants in a huge chunk of the south)

Nuclear plants, coal plants, and natural gas plants all produce electricity via boiling water. For this reason, these powerplants are called thermal plants. Thermal --as in heat. Right? Cool.

Hokay, so how efficient are these thermal plants? The maximum efficiency of a heat engine (which a thermal plant is) is (temperature in Kelvin!). Kelvin is the celcius scale, but is always positive. Absolute zero is 0 kelvin. 273.15°K is 0°C. Using Kelvin makes it way easier to do science.

The hot temperature is the temperature of our steam that drives the turbine. The cold temperature comes from whatever cold water they have handy. Often it is seawater, a lake, or a river. The cold water will probably be around 20C, or 293K. The hot temperature is the temperature of the steam in the thermal plant. Lets say that is 650K (roughly 377 celcius, quite a bit above the boiling temperature of water at 100C! This is very hot steam!)

or 55% efficient.

This is the maximum theoretical efficiency of a thermal power plant. It is how much heat can be converted to electricity. So say that our gallon of gasoline with 33kwh of power was burnt in a perfectly efficient power plant with 650°K steam. We would only obtain 33*.55 or roughly 18kwh of our 33kwh. The other 15kwh will just become waste heat. This maximum efficiency is never attained. There are always extra heat losses and efficiency losses throughout the power plant. Many coal-fired power plants only achieve 35% efficiency. The same gallon of gas would actually only be able to produce closer to 12kwh of electricity from our 33kwh of energy in the gallon of gasoline.

More math! (only slightly related, cause I want to do more math). Calculating how much heat is produced from stopping a bicycle is a fun way to get an idea of how heat and motion relate. For the setup, assume that I weigh 90kg and am bicycling at 10 meters per second.

The amount of kinetic energy (the energy just from moving) that I have is .5*mass*velocity2

. This is all of .125 watt hours. Not much at all. All of this kinetic energy is converted to heat energy in the brakes. Compare this to the energy from the first post about heating up a cup of tea, which took 31kj, or nearly 100 times as much. How bout a car? It travels at about 30m/s on the highway (about 70mph). It weighs 1000kg.

, or 125 watt hours. Stopping this car requires dissipation of a lot of heat at the brakes! That’s like 15 cups of tea worth of heat. Another way to look at this is that stopping this car would provide only enough energy to power a 100 watt lightbulb for an hour and 15 minutes. So that is how much energy the car has in its motion. It takes a lot more energy to get the car going that fast, though. Why? Cause the engine in our car is also a heat engine. It’s not very efficient at converting energy. A car is about 25% efficient. The other 75% is all converted to waste heat. The energy it takes to accelerate your car to 70mph could power a 100 watt incandescent lightbulb for 5 hours.

Okay! Back to the big picture!

Electricity Generation and Primary Energy

What is primary energy? Let’s step back and figure out all the way we use power plants and fossil fuels to make our lives easier. The first one is obvious: electricity. It powers our houses, lights, electronics, etc., and sometimes even is used for heating our houses. And it is definitely used to cool our houses with an air conditioner. The next obvious one is your car, which doesn’t run on electricity. We pour gasoline in, and then the engine converts the gasoline to kinetic energy and the car moves. After electricity production and transportation, what we have left is heating for home and industrial purposes. This can be done with coal (many poorer countries use low-quality coal to cook with), wood, natural gas, or any other combustible. As discussed above, electricity is produced by burning fossil fuels to produce heat. Electricity is a byproduct of primary energy.

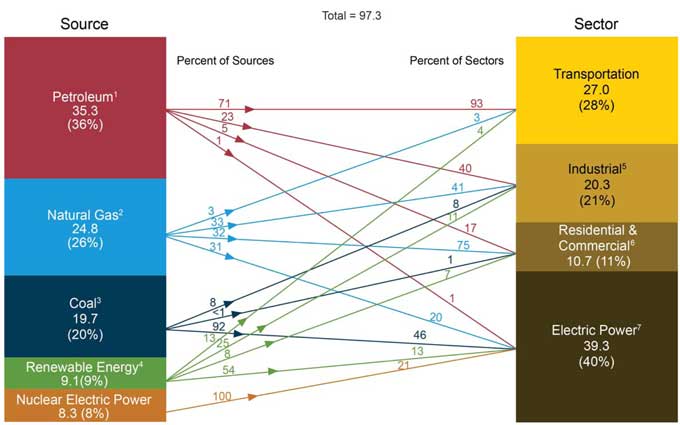
So that is what primary energy is. All that stuff added together. When most people think “Energy” they equate it with electricity. Now you know differently! A great example of this error was the reporting on the Fukushima nuclear meltdown in Japan. During the reporting, news organizations would regularly say that 20% of energy supplied in the US is from nuclear power. This, however, is wrong! Only about 10% of energy supplied in the US is nuclear. The 20% number is how much of our electricity comes from nuclear. First, what causes these two numbers to be different? And second, why do we even care?

That difference in between resource inputs and electricity output is part of the difference between primary energy and electricity. If we live in a tiny country that uses only one power plant to provide all of its electricity needs, and it uses only electricity for everything. It burns 100 gallons of gasoline an hour (this would never be a power plant input, but let’s keep it simple with numbers we know). It would burn 3340kwh of energy in that hour, and produce 1200kwh of electricity in that hour. Since this is our only energy use in the entire country, the former is primary energy use (3340kwh), and the latter is electricity use (1200kwh)!

This pretty picture from the DOE pretty much explains it all. And now you can explain it to others!

Primary Power is all the things that produce energy, whether it is burning coal in a power plant or gasoline in your car. These are our sources of energy, and where they end up.

Primary Power is all the things that produce energy, whether it is burning coal in a power plant or gasoline in your car. These are our sources of energy, and where they end up.

What about power plants that don’t use fossil fuels, like hydroelectricity? Easy! A 10MW hydro plant run for an hour registers as 10MWh both primary energy use and electricity use. An important takeaway here: if we lived in a 100% renewable and 100% efficient economy, primary energy use could nearly equal electricity use.

So this is one reason we care about the difference between primary energy use and electricity use. It is a measure of how efficiently we are using our resources, and how much we are getting for all that CO2 we are shoving into the air when we make electricity.

Let’s go back to everything that is primary energy. We have the inputs of heating, cars, and electricity production. Cars and heat are entirely primary energy use. We don’t really use electricity in many places to run either. So now we have everything we need to know to analyze primary energy vs. electricity, efficiencies of power plants, and energy efficiencies of whole economies! Pretty sweet, eh?

Okay, we are pretty much done here. I want to mention one last thing. That small powerplant we had, the one that burned 100 gallons of oil in an hour to produce 1200kwh? A real powerplant in the US produces in megawatts. Like 600 to 1000 MW. 600 times the size of our small powerplant. Even a small 600MW powerplant one would require 60,000 gallons of oil per hour. This is the scale we are talking when we have power plants.

-Jason Munster

Disposable Cups, part 2!

Hi again! Apologies for the lack of quantification in this post. It will be largely qualitative. I know how much everyone hates that.

Last time we discussed the energy use of reusable vs. disposable cups, and showed that the reusable cups require a significant number of reuses before they break even in regards to energy requirements when compared to single-use cups. This time we discuss pollution and disposal. When factoring in the pollution from production and the space required for disposal, reusable cups become more attractive.

Producing ceramic and glass cups is straightforward. It is only slightly more complicated than heating up dirt and making it into the shape you want. It takes a lot of energy to produce that heat, but few chemicals are used. There are some potential pollution issues associated with the dusts and powders used to create glass and ceramics, but proper techniques that are used in the developed world largely mitigate these.

Making paper requires pulping of the wood. Paper can use a chemical or mechanical process for making pulp. The chemical process can release some pretty gnarly chemicals and volatile organics. Ever been downwind of a paper mill? Paper production produces quite a bit of pollution. The mechanical process produces less pollution and ultimately costs less, but produces a lower quality paper. Wax or plastic is often added to the cup to make it water-tight, preventing decomposition. As far as disposal goes, most of it ends up in a landfill.

Styrofoam cups were manufactured with a method that produced CFCs for a long time, which rip apart the ozone layer. Emissions of CFCs were supposed to be arrested, so we didn't wreck our home planet. The process has since converted to HFCs; safer for the environment, but a significantly powerful greenhouse gas, with a per-molecule greenhouse strength about 1300x of CO2. Moreover, the production of Styrofoam releases volatile organic compounds. These ultimately help produce ground-level ozone and smog. We like ozone in the stratosphere, about 15km above our head, as it blocks harmful UV radiation from reaching us. We do not like it at the ground. It causes breathing difficulty and smog, and can contribute to rising asthma rates. In other words, Styrofoam production creates air pollution. When it comes times for disposal, like paper, most of this ends up in landfill.

It is clear that the energy used to produce and clean reusable cups is the largest negative environmental factor, which, as discussed in the prior post, is mitigated after many reuses. The production of disposable cups creates pollution, and the disposal requires a significant portion of landfill space. These factors contribute to a lower number of reuses of reusable cups before an environmental break-even it obtained.

-Jason Munster

Energy Requirements of Disposable Cups vs. Reusable, and Required # of Reuses to Break-even

Most people assume that using disposable cups is universally bad for the environment. In truth, it depends on how they are disposed of and what else would be used in the place of disposable cups. In this post, I focus solely on the energy necessary to create each type of cup, to clean them, and how many re-uses are needed for a reusable cup to have a per-use energy cost lower than a disposable cup. The lifecycle energy use for disposable cups vs. ceramic and plastic cups have a surprising result: a restaurant will need to use a cup nearly 300 times to have break-even energy use*. Home use can be much better**, thanks to our much more lax health standards at home.

The scope of this post is limited to energy, which fails to provide a whole picture view. The next post will discuss other aspects, including pollution and greenhouse gases made during production, disposal, the intrinsic value of having a recycling mindset, and details about how the differing sources of energy used for production make a huge impact on these other factors.

The first part of this post will be pretty boring for most of you, containing basic explanation of units and dimensions that you will already know. If this is old hat to you, skip past the “basic background” section. It is meant for people who are unfamiliar with the basic physics behind energy who might be rusty calculating energy requirements for heating something.

If you know basic physics, skip down to the part beginning with "lifecycle energy assessment"

Basic Background – Energy, Joules, Heat, and Power

The really basic stuff: heat (most people should skip to next section, unless you know zero physics)

This section briefly goes over the basic units of energy. The unit of energy is a joule. It takes 4.2 joules per gram of water to raise it one degree Celcius (or about 2 degrees Fahrenheit). This number, 4.2 is called the specific heat of water.

This brings up another important concept: heat vs temperature. Everyone knows what temperature is. Not everyone knows what heat is. Heat is a measure of how much energy you have to dump into one gram of a substance to raise it one degree. Water, as we said, takes 4.2 joules. Iron take about one tenth of that, or .45 joules. Think about it this way: if you have a quarter of cup of nearly boiling 90°C water, and it falls on you, you are going to the hospital for some burn treatment. If you have a similar mass of 90°C iron fall on you, the heat of it won’t do much damage (although if it falls from high enough, it might hurt). So, roughly, for a given temperature, something with a higher specific heat has a lot more energy.

How much heat energy does it take to heat a large amount of water? To do this, we take the mass, multiply by the specific heat (represented by c), and then multiply by temperature change: m*c* ΔT, where the Δ means change, and Δt means change in temperature.

Less basic stuff

A cup of water is about 250 milliliters, or 250 grams. Raising a cup of coffee to 40° Celsius (about 100° F) from 10° Celsius would take:

Notice that the units of degrees Celsius and grams cancel out, with 1/(gC) from specific heat being multiplied by g and C from the weight and temperature parts of the equation, leaving only Joules. Sweet.

Anyways, 31,500 J is also written as 31.5 kJ (31.5x10³ J). Let’s take a moment to convert this to kwh, or kilowatt hour, the standard unit of energy you pay for in your house. A watt is using one joule per second. If we took the coffee cup above, and wanted to heat it in 30 seconds, we would expend 1050 watts for 30 seconds (31.5kJ/30s). How many kwh is this? 31,500J/3600s = 8.75 watt-hours, or .00875 kwh.

Another point of reference for energy is the amount contained in one gallon of typical gasoline in your car. This is 120MJ (120x106 J). 120x106 J/3600s is 33.4x10³ watts, or 33.4kwh. You could heat nearly 3800 cups of water to this tepid temperature with only one gallon of gasoline! Or you could drive 20 miles in a car. Or you could heat 3 baths with it (70 gallons of water per bath, water at 40°C, 16 cups in a gallon).

Alright, we are done discussing background energy for now. Onto the real stuff!

Lifecycle energy assessment of disposable extruded polystyrene (Styrofoam) cups vs. plastic and ceramic cups

In 1994, a professor named Hockins analyzed the energy use of disposable vs. ceramic cups. It includes the energy required to extract the components used to create the cups, the process used to form the compounds into cups, and for ceramic cups, the energy required to wash them.

Styrofoam cups (my word processor automatically capitalizes “Styrofoam” and I am too lazy to correct it) are a petroleum product called polystyrene. Styrofoam is the exact same material used in the disposable plastic silverware you use at picnics and other events, and also the cases that CDs come in. How does it get light and fluffy, then? In the manufacture of Styrofoam, gases are dissolved in the molten polystyrene under very high pressure. The Styrofoam is shaped into whatever shape they choose, then brought rapidly to low pressure (extruded, hence the name extruded polystyrene). The bubbles of gas dissolved in the polystyrene expand under low pressure, making Styrofoam mostly air (technically mostly a gas) with polystyrene holding it in place. They are typically disposed after one use. If disposed of properly, the polystyrene can end up at an incinerator where it produces mostly CO2 and H2O upon burning. In this way, part of the energy to make the cup can be reclaimed. If the Styrofoam is disposed of normally, it may be burnt to release black carbon and particulate matter, or end up in a landfill.

Ceramic cups are largely heated clay. The material needs to be mixed in the right proportions, shaped, and heated several times to dry and hold its form. The heating process requires a lot of energy. Moreover, washing the cups requires quite a bit of energy to heat the water for washing the cups.

Let’s get into the numbers.

Our reusable cups: A ceramic cup takes 14.1 MJ per cup to manufacture. A pyrex cup takes 5.5 MJ to manufacture, a reusable plastic cup takes 6.3 MJ. Our disposable cups: an uncoated paper cup is .5 MJ (500 kJ), and a Styrofoam cup is .2 MJ (200 kJ). The first thing we see is that manufacturing disposable cups requires between 4% (Styrofoam) and 10% (paper) of what it takes to make the most energy efficient reusable cups (glass and plastic). In other words, at very best, a plastic cup needs to be used 25 times to be as energy efficient as a Styrofoam cup, or 10 times to be as efficient as a paper cup. A ceramic coffee mug would require 75 uses before it would hit break-even energy as a Styrofoam cup, or 30 uses compared to a paper cup.

Now let’s account for the cost of washing. The same source indicates that a commercial washer requires between 80 and 120 kJ of energy to wash a single cup amongst an entire normal wash load. Compare this to the 31.5 kJ we calculated to heat coffee to a warm temperature. The differences arise in the amount of water necessary to wash and then rinse a cup in a commercial washer, and the higher temperature used in commercial washers compared to the temperature at which we drink in coffee or tea. A commercial washer has a wash cycle, a rinse cycle, and heats the water to a scalding 80 degrees C. Another important factor considered in this, which we will discuss in a later blog post, is the difference between energy used, and energy expended at a power plant to produce the energy used by the commercial washer. Power plants are not very efficient. The average power plant in the US will deliver only 35% of the energy from the fuel it burns. So we have to divide the wash energy by .35, getting a higher number of energy burnt to wash our cups.

Dividing the 80 kJ of energy of a dishwasher by a .35 efficiency results in nearly 230 kJ to wash a cup. This is more than it takes to produce a basic Styrofoam cup. In other words, in the US, no matter how many times you use a mug in a commercial setting, the total energy required will always exceed the energy used in a Styrofoam cup. Note that this is not the same as CO2 emissions (next post covers this!)

But hold on! Who uses a commercial dishwasher in their home? More importantly, who washes their cup every time they use it, besides my sister? Taking the former case and assuming we very efficiently wash the cups by hand, assuming it takes ½ a cup of warm water (heated up by 30°C) to wash a cup (both the temp and amount** of water use are highly optimistic!), and using ½ of what we calculated in the example section, it takes about 16kJ to wash a cup, or close to 45kJ accounting for the efficiency of electricity production. Now we are back to a break-even point closer to 100 uses for a ceramic mug, or around 35 for a glass! Not bad! And if you are like me, and you usually just rinse a mug with cold water and let it dry, or don’t wash it at all because you will be putting the same tea/water in next time, energy use is negligible, bringing us much closer to those 75 and 25 uses!

That’s enough for now. But there is so much left to discuss here! We need to consider many other factors. Pollution from production and disposal of disposable cups, energy sources used for electricity and how clean each is, recycling habits, landfill volume requirements etc.

What can we take away from this before we discuss all the other stuff? Be careful when you say that glasses and mugs are more energy efficient than Styrofoam or paper mugs. This takes many reuses. Another important implication: if you are throwing a party, you are better off buying paper cups (which can be recycled) and recycling them afterwards than you are buying glasses that will only be used during that party (or maybe one or two future parties).

This post is getting long, so I am going to sign off for now, and perhaps revisit this again later. Thanks for checking it out!

-Jason Munster

Edits (11-29):

* Lucas asked about a home dishwasher. A very efficient home dishwasher uses 3.6MJ of energy per wash (from EnergyStar). Assume you can cram 40 cups in there, you have 90kJ per cup, which would bring ceramic break-even re-uses to about 125, and glass to about 45.

** A lot of people are very wasteful when they wash dishes by hand, using a ton of hot water (as in running the water the entire time, probably using 8 cups of water to wash a cup). This is very inefficient and will never allow for break-even energy use.